DataForge
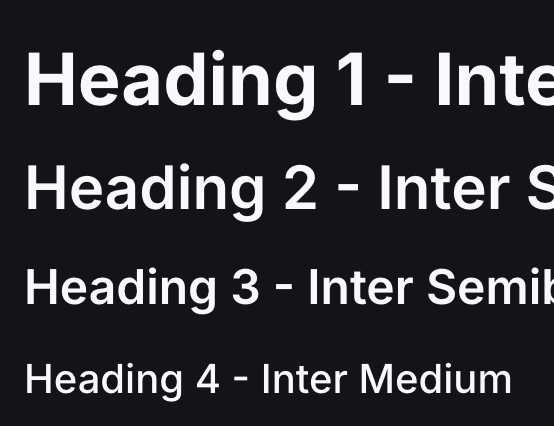
Scalable Design System

Client
POC
Date
January 2026
Tech
React, Tailwind CSS
A sleek, adaptive Design System transforming complex data into clear, actionable insights through intuitive design and real-time visualization.
Intuitive Benutzeroberfläche für Datenfusion
It features a highly intuitive, interface centered graph-based data visualization, geospatial mapping, and timeline views.

Seamless Explorer
Navigate complex data webs through intuitive graphs, maps, and timelines in a sleek workspace.
Desktop
Streamlined desktop interface for exploration, geospatial views, and timeline workflows in a unified ontology hub.
Mobile optimized
Touch-optimized interface for on-the-go graph navigation, pinch-to-zoom maps, and swipeable timelines in a compact enviroment.
Scalable, component-driven framework with atomic nodes, graph primitives, and responsive layouts ensuring consistent usability across desktop and mobile.

Neutral Color Palette
Subdued tones with strategic highlights for optimal contrast in Dark- and Lightmode.
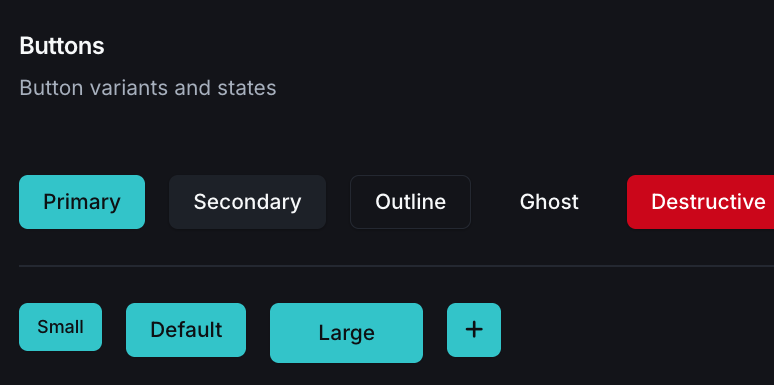
Core Components
Modular entities like node-link graphs, interactive maps, swipeable timelines, and ontology panels for dynamic data interrogation.
Accessibility-Focused Design
High-contrast elements, scalable typography, keyboard-navigable graphs, and screen reader-optimized structures ensure WCAG-compliant access.

Mobile
Pattern
Impress yourself
“My Dataforge Design System uses clear icons, eye-catching logos, and easy charts to make data accessible for all. Turning complex data into simple, everyday tools.”